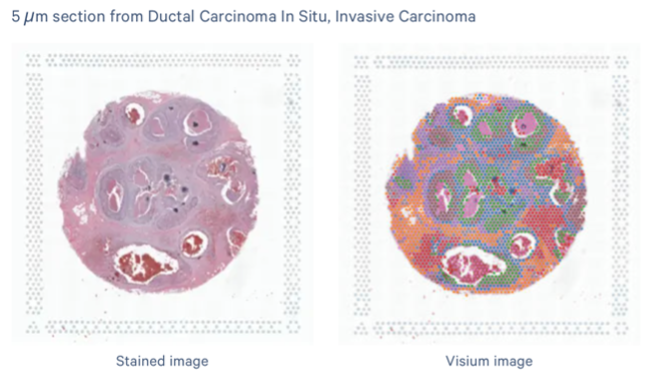
What is Visium FFPE v2 with CytAssist?
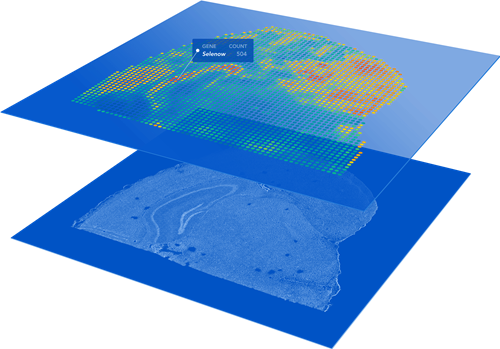
Visium FFPE v2 is sequencing-based spatial profiling technology developed by 10x Genomics. This assay can take mouse or human tissue sections on normal glass slides as input and will provide a whole transcriptome survey of the gene expression profiles across the tissue section. Resulting data will be gene expression counts value for each spatial spot (55 micron diameter, 100 micron from each other), which is overlayed over the original tissue image. While the current version does not provide single cell resolution, the whole transcriptome analysis across the entire interrogated tissue region will provide a relatively unbiased survey of the spatially organized gene expression in a given sample. Upcoming versions will improve upon resolutions.
Key Features
- Whole Transcriptome: Human or mouse probes survey whole transcriptome.
- FFPE Compatibility: FFPE tissue samples on normal glass slides used as input.
- No ROI Selection: Arrayed spatial spots provide unbiased profile of tissue.
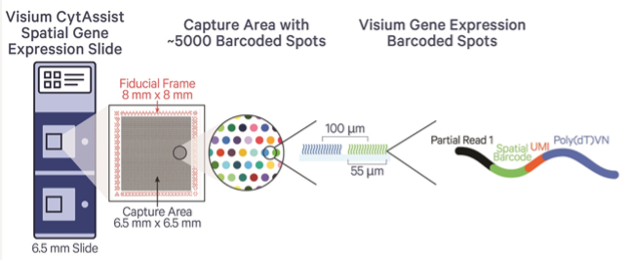
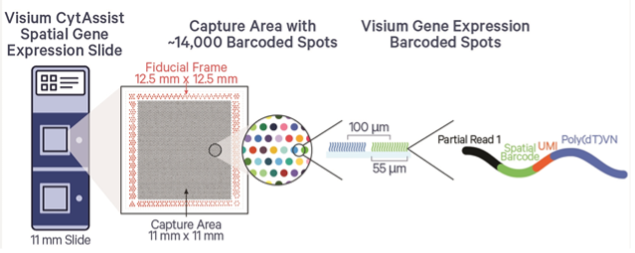
- Two Size Options: Choose 6.5×6.5mm or 11x11mm spatial capture windows.
Applications
- Cancer Research: Understand tumor heterogeneity and microenvironment.
- Drug Discovery: Investigate drug response within tissue context.
- Developmental Biology: Explore gene expression patterns during development.
How Does it Work?
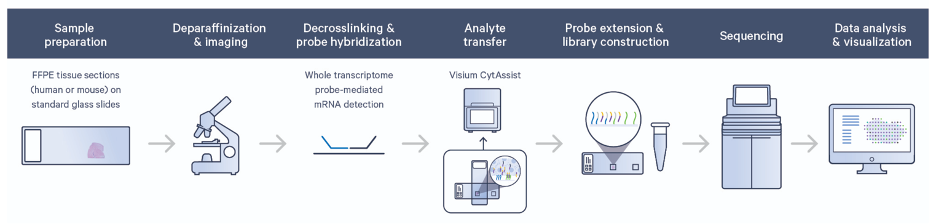
Visium FFPE v2 utilizes a whole transcriptome probe set (currently limited to human or mouse) to allow for high-throughput, genome-wide spatial analysis of gene expression in situ. Tissue is prepared on a normal glass slide, where it can be stained and imaged (such as H&E), and then it is processed for probe hybridization. Hybridized probes bound in the tissue are then transferred using the CytAssist platform to a special spatially barcoded slide where oligos capture the released probes. Libraries are generated and sequenced and resulting probe-based gene expression counts are aligned back to their spatial origin in the tissue. This enables researchers to explore the spatial distribution of RNA transcripts within tissue sections.
Project Support
To get more information or to discuss a potential supported project at CCR, please contact the Single-Cell and Spatial Core (SCSC).
Disclaimer: The information provided here is based on the latest available data and may be subject to updates.